Rain Gauges, Dashboards, and Cellular-Capable Sensors: My Summer on the SSLS Team
Oct 21, 2021
I’m Mark Leggiero – one of two interns named ‘Mark’ working on the Sensor Development Team for the SMART Sea Level Sensors (SSLS) project. I am a senior at Georgia Tech with a dual major in Mechanical Engineering and Physics, and this is my first semester interning with Serve-Learn-Sustain, the Institute for People and Technology, or SMART Sea Level Sensors!
Starting Off – Adapting to my Project
I’ve made great strides in growing my technical skills throughout this summer internship. Most of my previous experiences in sensor networks came through working on robots and automated systems during internships, courses, and personal projects (which mostly just required knowledge of mechanical systems and design). However, my work with SSLS has been focused on software development, and therefore I’ve had to become more adept in this field. To this end, I’ve learned a great deal about software development and communication protocols.
Adding Rain-Gauges to Understand Rainfall
The SMART Sea Level Sensors project manages a wide network of water level, temperature, pressure, and air quality sensors. My work began as the project leadership identified measuring rainfall as a logical next step to improve their capabilities. Understanding rainfall, for one, can help disaster management in Chatham County better understand which areas are experiencing heavy storm events. Additionally, this can aid in climate research, where rainfall presents an important factor in properly modeling flood events. It is fair to say that most of this variation in sea level comes from the ocean’s tide, however this isn’t the entire picture. Rainfall, inlet river flow, and other factors also affect water level in the region, especially as one looks further away from the coast.
Our first step was a market analysis for commercially available rain gauges. Through comparing 25+ models of rain gauges, ranging in technologies, prices, accuracies, etc., we selected Hydrological USA’s TB4 gauges. Currently, the project uses custom electronics (developed by Georgia Tech researchers Scott Gilliland and Peter Presti in collaboration with the Institute for People and Technology) to send data from the water level sensors to the dashboard using an ESP32 (a commonly available microprocessor) and LoRaWAN chip (Long Range Wide Area Network – a low-power radio communication protocol). A significant percent of my work this summer was spent getting the existing hardware to function with the TB4 rain gauges. Our largest challenge was ensuring that the updated firmware functioned in a manner which required as little power as possible, since the sensor units are run on batteries.
Initially, we hoped the software we developed would allow us to use either a water level sensor or rain gauge, but given the simple operation of the TB4 (a tipping-bucket rain gauge), we were able to update the firmware of the LoRaWAN hardware to collect both rainfall and water level data concurrently and through one unit.
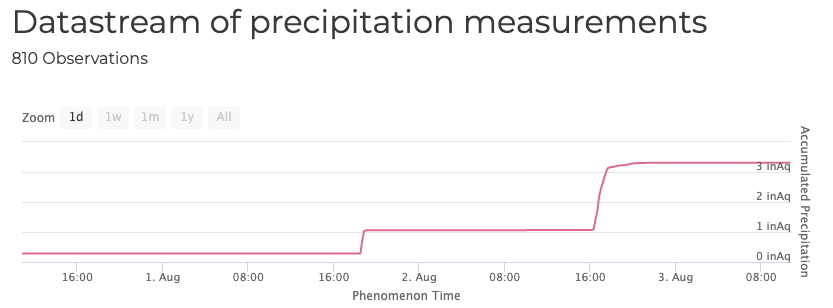
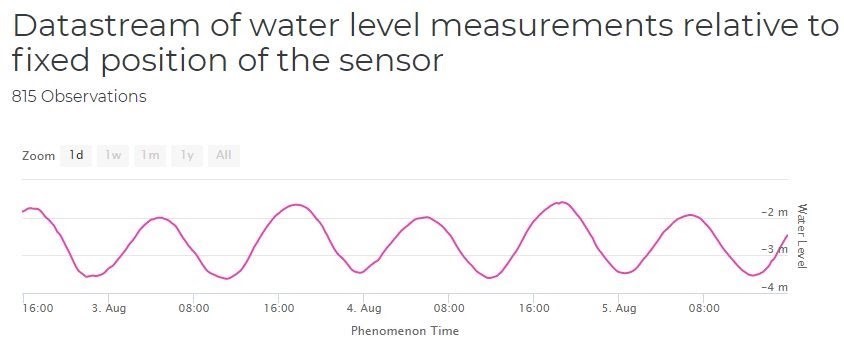
Since completing the first stable version of the new LoRaWAN firmware, we have deployed three units attached to rain gauges for testing (at the time of this post, each is labeled as a “Pre-Deployment Validation”). They are functional and uploading concurrent rainfall and water level data to our dashboard at their respective locations in Atlanta and Savannah:
Cellular-Capable Sensors
Transitioning from the rain gauges, the Sensor Development Team started work on implementing hardware which can send sensory data to the dashboard while only requiring a cell connection. This is mostly helpful in areas where radio communication (such as that used by the LoRaWAN board) is not very effective – including regions with a dense tree canopy. Scott and Peter have developed such a board, which is similar to the LoRaWAN unit, but requires different methods for developing its firmware. Namely, the heart of the board, the nRF9160 chip, can be programmed with custom software provided by Zephyr.
After successfully communicating with the nRF9160 chip, the team worked on understanding how the board would send data to the dashboard. We selected the MQTT (Message Queuing Telemetry Transport) communication protocol for sending sensor data, and use an open-source MQTT library, Mosquitto. We were able to accomplish sending pe-determined messages from the cellular board to a web-server we hosted on a low-cost Raspberry Pi 4B computer (used mainly for testing).
The next step for us is to write a program that allows the board to collect sensory data, starting with water level, and convert the data into a suitable message for MQTT. Given differences between LoraWAN and nRF9160 boards, setting up serial communication between the nRF9160 and ultrasonic sensor had been a challenge. Our final work on this board has been understanding the nRF9160 and Zephyr serial interface, and documenting our progress for whoever picks up this work in the future!
Concluding Thoughts
As mentioned near the beginning of this post, I learned a lot of valuable technical skills during these 12 weeks on this project. I am proud of what the Sensor Development team accomplished, especially since rain gauge units were able to be deployed. However, I want to appreciate the multidisciplinary aspects of the project (which were beyond my work). The SMART Sea Level Sensors project could have been counted as a ‘success’ if it stopped at environmental monitoring, however, through the vision of the project leadership (Dr. Kim Cobb, Dr. Russ Clark, Randall Matthews, Nick Deffley, and others), they have impacted the Chatham / Savannah area in numerous ways, emphasizing social justice. I have grown to admire, and hope to emulate, their forward-thinking in this area.
Lastly, I want to specifically thank Mark Putman, Dr. Russ Clark, Scott Gilliland, and Peter Presti for a meaningful internship experience!
Be the first to comment!